
Research · Testing & Assessment
Functional Movement Screening: What It Actually Predicts About Injury (and What It Doesn't)
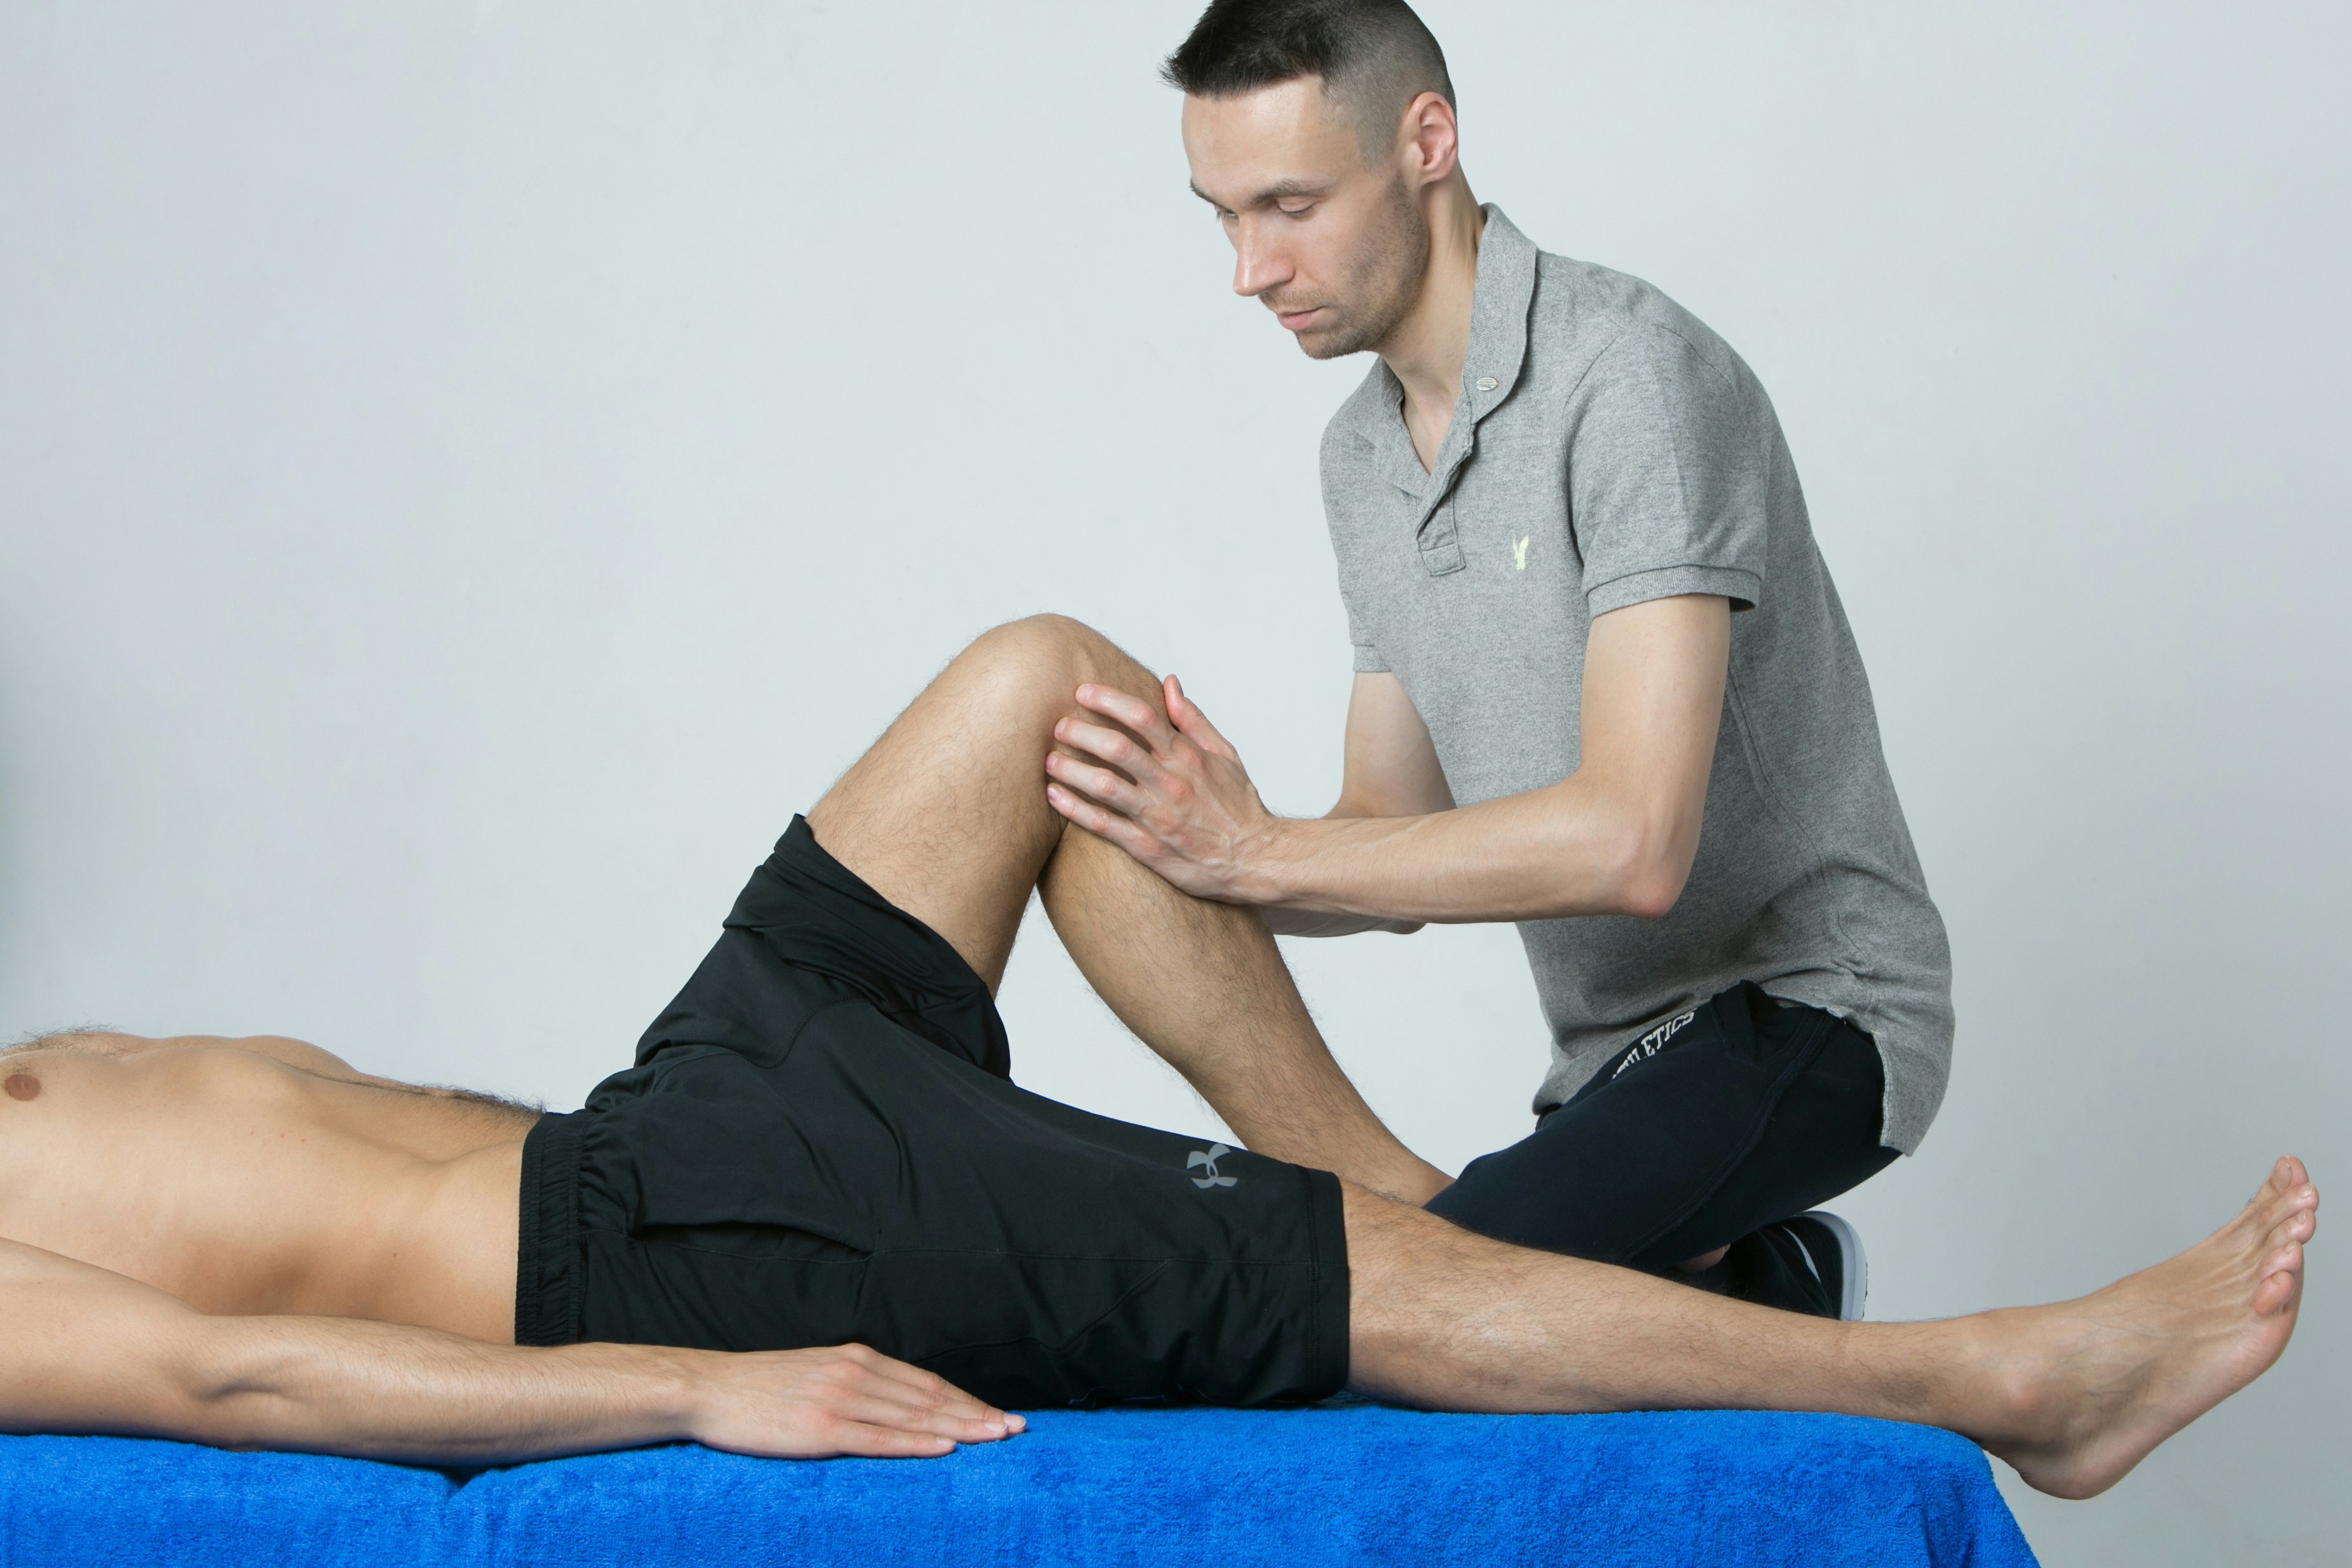
Walk into enough gyms, pre-season physicals, or combine-testing days and you'll eventually hear a coach say some version of: "he scored a 12 on his FMS, he's high risk." The Functional Movement Screen has become one of the most widely adopted screening tools in sport and the military — cheap, fast, requiring no equipment beyond a dowel and a low box, and producing a single number that gets treated like a diagnosis. The threshold usually cited as the line between "fine" and "at risk" is 14 out of a possible 21.
That number, and the injury-prediction claim built on top of it, traces back to a specific study. It's worth knowing exactly how that study was built, what happened once the same question got asked at a much larger scale, and what the field's own meta-analyses — there are now several, and they don't agree with each other — actually found.
What the screen is actually testing
The FMS was developed by physical therapist Gray Cook and athletic trainer Lee Burton and formally described across two 2006 papers in the North American Journal of Sports Physical Therapy.1 It scores seven fundamental movement patterns — deep squat, hurdle step, in-line lunge, shoulder mobility, active straight-leg raise, trunk stability push-up, and rotary stability — each on a 0-to-3 scale, for a composite score out of 21. A 3 means the pattern was performed cleanly; a 0 means pain was present anywhere in the movement. The appeal is obvious: the screen takes roughly ten minutes, needs no lab equipment, and produces something that looks exactly like a lab result — a single, comparable number.
The study that made the cutoff famous
The claim that a score of 14 or below predicts injury comes from a 2007 study by Kiesel, Plisky, and Voight, published in the same journal.2 Researchers screened 46 professional American football players on a single NFL team before the season and tracked who went on the injured reserve list for three or more weeks. The result was striking: athletes scoring ≤14 had 11.67 times the odds of sustaining a serious injury, with 91% specificity — correctly clearing most uninjured players — and 54% sensitivity, correctly flagging just over half of those who went on to get hurt.
An odds ratio of nearly 12 is a dramatic effect size for any injury-risk factor in sports medicine. It's also based on one team, one season, and a sample of 46 players — small enough that a handful of injuries in the "low score" group can swing the whole result. That doesn't make the finding wrong. It makes it exactly the kind of early, small-sample result that sports-science evidence hierarchies treat as a hypothesis worth testing further, not a conclusion worth building a product around.
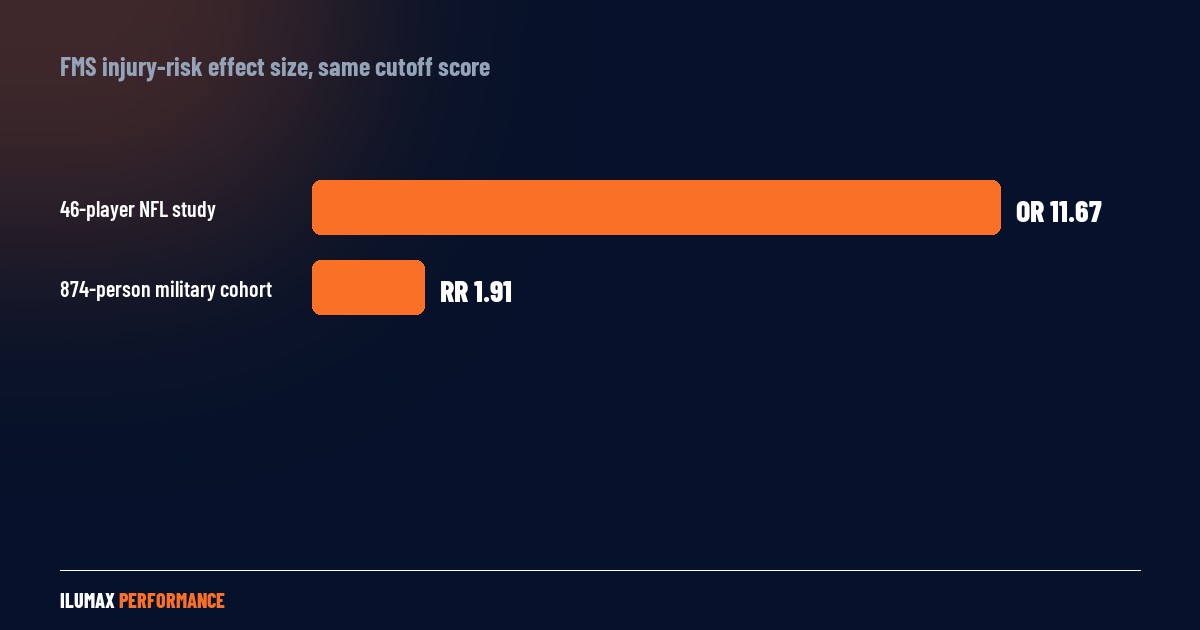
The same ≤14 cutoff, tested at very different scales — Kiesel et al., 2007; O'Connor et al., 2011.
What happened at nearly twenty times the sample size
The clearest test of whether that effect held up came in 2011, when O'Connor, Deuster, Davis, Pappas, and Knapik screened 874 Marine officer candidates and tracked injuries through training.3 The same ≤14 cutoff was associated with 1.91 times the risk of any musculoskeletal injury — real, but a fraction of the effect reported in the NFL sample. Sensitivity for any injury was 45%, meaning the screen missed more than half of the candidates who went on to get hurt; for injuries serious enough to end training altogether, sensitivity dropped to 12%. Specificity stayed reasonably high in both cases (71% and 94%), which mostly means the screen is fairly good at leaving uninjured people alone — not that it's good at identifying the ones who won't be.
This is a familiar and well-documented pattern in early injury-risk research generally: a striking effect size in a small, homogeneous, single-site sample, followed by a considerably more modest one once the same question gets asked in a larger, more representative population. It happened here. The number that gets repeated in gyms is almost always the first one, not the one that came from the bigger, better-powered study.
What the meta-analyses say — and why they don't agree
By now there are enough individual studies to pool, and several research groups have tried. They don't reach the same conclusion.
Bonazza, Smuin, Onks, Silvis, and Dhawan (2017), in the American Journal of Sports Medicine, pooled nine studies on injury prediction and found the odds of injury were 2.74 times higher with a score of ≤14 (95% CI, 1.70–4.43) — a real, statistically significant pooled effect, well short of the original NFL number.4 The same paper reported good rater reliability (an intraclass correlation of 0.81 for both inter-rater and intra-rater agreement) but explicitly flagged "significant concerns" about the underlying validity evidence.
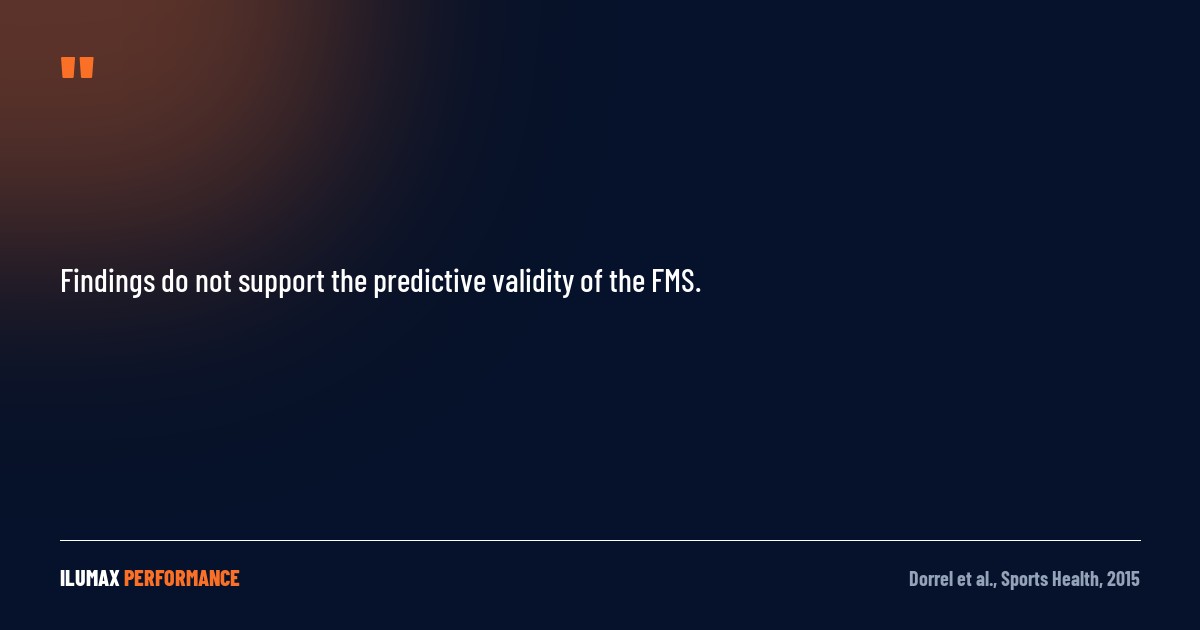
Dorrel, Long, Shaffer, and Myer (2015), in Sports Health, pooled seven studies and reported the FMS was considerably better at ruling injury risk out than ruling it in: 85.7% specificity against just 24.7% sensitivity, a positive predictive value of 42.8%, and an area under the curve of 0.587 — barely above chance.5 Their stated conclusion was direct: "findings do not support the predictive validity of the FMS."
Moran, Schneiders, Mason, and Sullivan (2017), in the British Journal of Sports Medicine, reviewed 18 studies and found the evidence too inconsistent — across sports, sexes, and injury definitions — to support using the composite score as an injury-risk estimator at all.6
Bunn, Rodrigues, and Bezerra da Silva (2019), in Physical Therapy in Sport, pooled 20 studies using relative risk rather than odds ratios and landed closer to Bonazza's estimate: athletes classified "high risk" were 51% more likely to be injured than those classified "low risk"7 — a real but modest signal, not the dramatic one the original study reported.
"Findings do not support the predictive validity of the FMS."
Four meta-analyses, four different pooled effect sizes, and no shared verdict on whether the tool has a place as a stand-alone predictor. That isn't a case of one team getting it right and the others getting it wrong. It's what the underlying evidence looks like once genuinely heterogeneous studies get pooled honestly.
Why the studies disagree with each other
Part of the answer is that "the FMS predicts injury" was never really one claim being tested the same way twice. Moore, Chalmers, Milanese, and Fuller (2019) reviewed the moderating factors directly — age, sex, sport type, and how "injury" itself was defined — and found each of these shifted the FMS-injury relationship enough to explain a meaningful share of the disagreement between individual studies.8 A cutoff built on college-aged American football players doesn't automatically transfer to a youth netball squad, a recreational runner in their 40s, or a contact sport where most injuries come from collision rather than movement quality. Pooling studies across all of those populations, which several of the meta-analyses above have to do to reach a usable sample size, mixes together relationships that may not behave the same way to begin with.
There's also a distinction worth being precise about, because it's easy to blur. Reliability and validity are not the same question. Bonazza's intraclass correlation of 0.81 says two raters scoring the same athlete on the same day will largely agree on the number — that's reliability, and the FMS does reasonably well on it. Whether that reliably measured number then forecasts an injury that hasn't happened yet is validity, and that's the question the meta-analyses answer so differently from each other. A tool can be scored consistently and still not be measuring something that predicts what it's being used to predict.
A more defensible use: combine it, don't gate on it
The one place the injury-prediction numbers get noticeably stronger is where the FMS stops being asked to carry the job alone. Lehr, Plisky, Butler, Fink, Kiesel, and Underwood (2013) built a multifactorial algorithm combining FMS composite score and asymmetry with Y-Balance Test performance, injury history, current pain, sex, and sport, then tested it on 183 collegiate athletes.9 Athletes flagged "high risk" by the combined algorithm were 3.4 times more likely to be injured (95% CI, 2.0–6.0) — a larger effect, and a tighter confidence interval, than any FMS-alone cutoff produced at a comparable sample size.
A 2025 review in the journal Sports by Eckart, Sharma Ghimire, Stavitz, and Barry surveyed the current state of the field and reached a similar recommendation from the opposite direction: rather than a single population-wide cutoff, the strongest available evidence favors individualized, multifactorial models that combine movement screening with modifiable factors like training load and fitness and non-modifiable factors like age, sex, and injury history — tracked per athlete over time rather than judged against one universal threshold.10
- A single score isn't a verdict. Both the strongest and the weakest pooled effect sizes above sit well short of what would justify benching an athlete, denying clearance, or guaranteeing safety off one FMS number alone.
- Sensitivity matters more than it gets credit for. A screen running 25–45% sensitivity, however specific, is going to clear the majority of athletes who go on to get injured. Treating a clean score as a green light ignores exactly what these numbers say.
- Combined, individualized, and longitudinal beats single, universal, and cross-sectional. The evidence is most favorable where a movement screen is one input among several, tracked against an athlete's own history rather than applied as one population-wide cutoff to everyone in the room.
What this means for how a screen should actually be used
None of this makes movement screening worthless. A deep squat, a lunge, and an overhead reach take ten minutes, cost nothing, and are a genuinely useful first look at where an athlete is missing range of motion or control before load goes up. What the peer-reviewed evidence doesn't support is treating a single composite score, on its own, as a reliable forecast of who gets hurt and who doesn't — the field's own meta-analyses can't agree on how strong that relationship even is, and the more carefully built versions of the tool now combine it with several other pieces of information rather than leaning on the score alone.
That's the same discipline a testing-first program should be applying everywhere else on this site — a movement screen is one baseline data point in an athlete's file, tracked against their own history alongside strength, power, and training load, not a stand-alone verdict issued from a single ten-minute test. A program that runs a screen and reads the result as one input among several is doing assessment properly. A program that runs a screen once and hands out a pass/fail injury-risk label from that score alone is asking more of a ten-minute test than fifteen years of peer-reviewed research says it can deliver.
Sources
- Cook G, Burton L, Hoogenboom B. "Pre-Participation Screening: The Use of Fundamental Movements as an Assessment of Function – Part 1." North American Journal of Sports Physical Therapy 1(2):62–72, 2006. pmc.ncbi.nlm.nih.gov/articles/PMC2953313.
- Kiesel K, Plisky PJ, Voight ML. "Can Serious Injury in Professional Football be Predicted by a Preseason Functional Movement Screen?" North American Journal of Sports Physical Therapy 2(3):147–158, 2007. pubmed.ncbi.nlm.nih.gov/21522210.
- O'Connor FG, Deuster PA, Davis J, Pappas CG, Knapik JJ. "Functional Movement Screening: Predicting Injuries in Officer Candidates." Medicine & Science in Sports & Exercise 43(12):2224–2230, 2011. pubmed.ncbi.nlm.nih.gov/21606876.
- Bonazza NA, Smuin D, Onks CA, Silvis ML, Dhawan A. "Reliability, Validity, and Injury Predictive Value of the Functional Movement Screen: A Systematic Review and Meta-analysis." The American Journal of Sports Medicine 45(3):725–732, 2017. pubmed.ncbi.nlm.nih.gov/27159297.
- Dorrel BS, Long T, Shaffer S, Myer GD. "Evaluation of the Functional Movement Screen as an Injury Prediction Tool Among Active Adult Populations: A Systematic Review and Meta-analysis." Sports Health 7(6):532–537, 2015. pmc.ncbi.nlm.nih.gov/articles/PMC4622382.
- Moran RW, Schneiders AG, Mason J, Sullivan SJ. "Do Functional Movement Screen (FMS) Composite Scores Predict Subsequent Injury? A Systematic Review with Meta-analysis." British Journal of Sports Medicine 51(23):1661–1669, 2017. pubmed.ncbi.nlm.nih.gov/28360142.
- Bunn PDS, Rodrigues AI, Bezerra da Silva E. "The Association Between the Functional Movement Screen Outcome and the Incidence of Musculoskeletal Injuries: A Systematic Review with Meta-analysis." Physical Therapy in Sport 35:146–158, 2019. pubmed.ncbi.nlm.nih.gov/30566898.
- Moore E, Chalmers S, Milanese S, Fuller JT. "Factors Influencing the Relationship Between the Functional Movement Screen and Injury Risk in Sporting Populations: A Systematic Review and Meta-analysis." Sports Medicine 49(9):1449–1463, 2019. doi.org/10.1007/s40279-019-01126-5.
- Lehr ME, Plisky PJ, Butler RJ, Fink ML, Kiesel KB, Underwood FB. "Field-Expedient Screening and Injury Risk Algorithm Categories as Predictors of Noncontact Lower Extremity Injury." Scandinavian Journal of Medicine & Science in Sports 23(4):e225–e232, 2013. pubmed.ncbi.nlm.nih.gov/23517071.
- Eckart AC, Sharma Ghimire P, Stavitz J, Barry S. "Predictive Utility of the Functional Movement Screen and Y-Balance Test: Current Evidence and Future Directions." Sports 13(2):46, 2025. pmc.ncbi.nlm.nih.gov/articles/PMC11860429.
Want this applied to your own program, team, or school? Free 20-minute consult, no obligation.
Book a free consult →