
Research · Testing & Assessment
The Dynamometer Is Precise. The Hamstring-to-Quad Ratio Still Can't Tell You Who Gets Hurt.
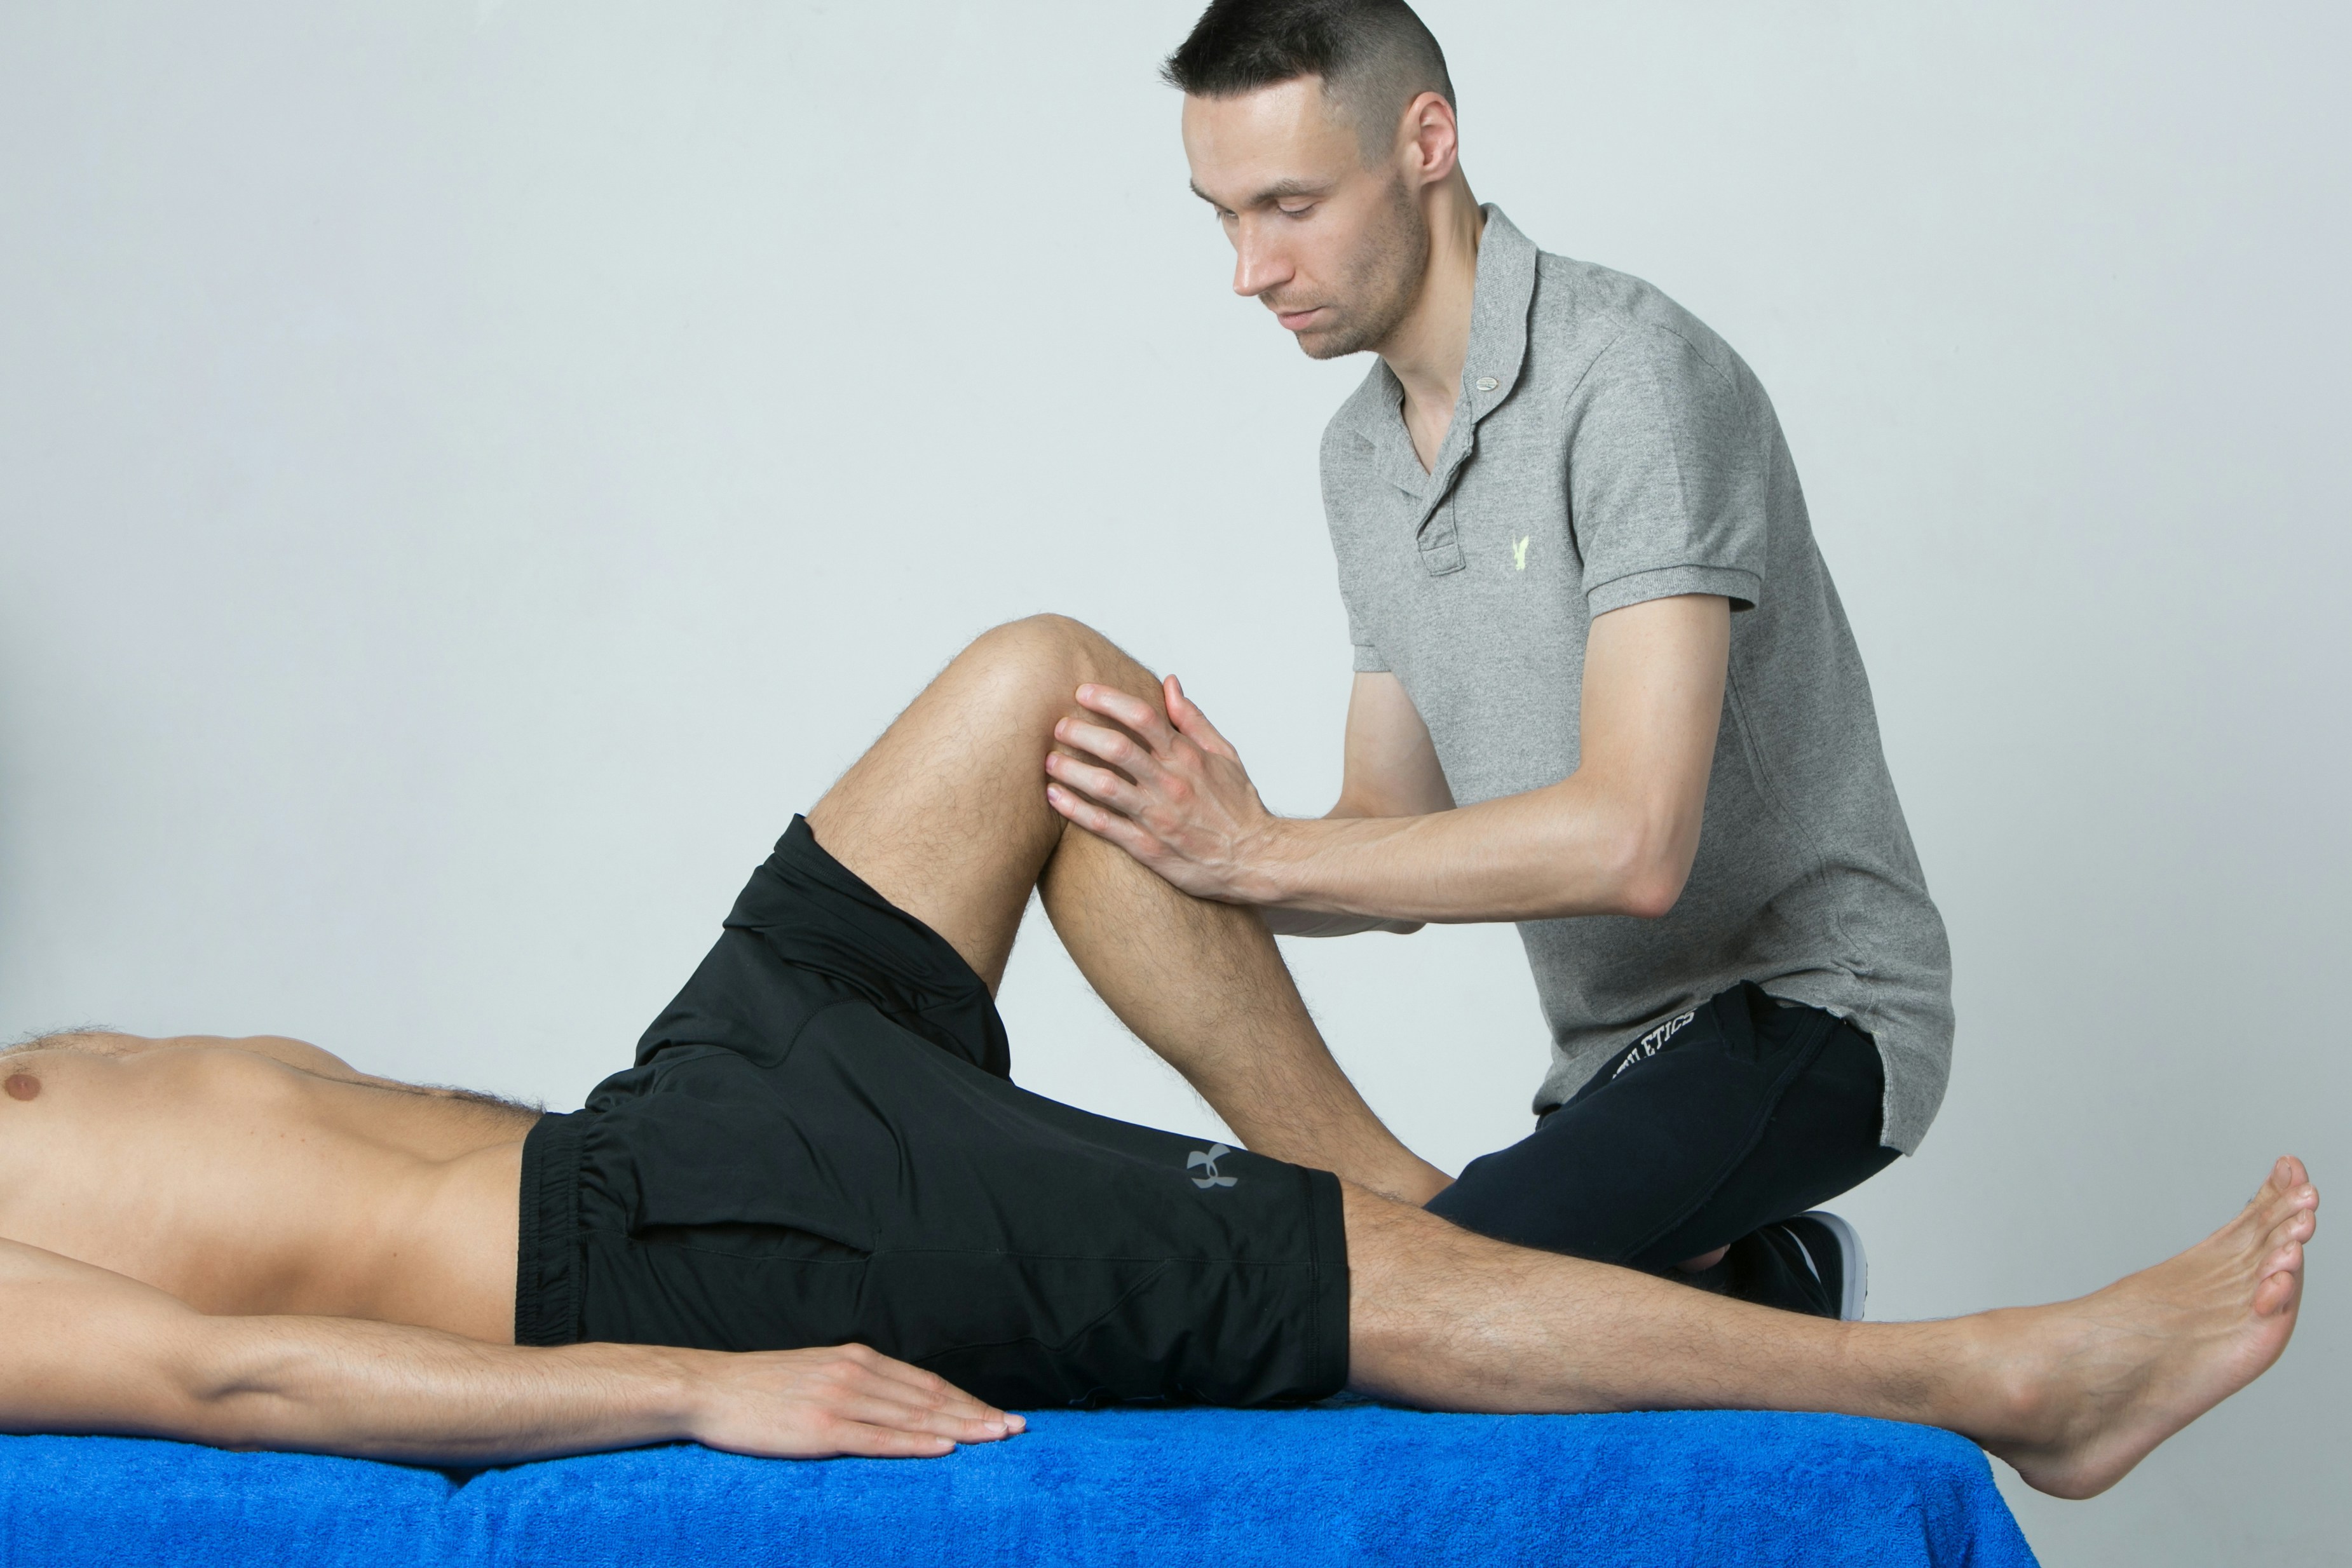
A fifteen-year-old footballer sits strapped into a dynamometer chair, thigh pinned, torso belted, swinging one leg against a lever arm that refuses to move faster than it is told to. Ten minutes later the printout arrives: peak torques at two speeds, a left-right comparison, and a hamstring-to-quadriceps ratio highlighted in red. The parent's question is the obvious one. Does this mean the hamstring is going to tear?
The honest answer, according to the best prospective evidence we have, is that the red number cannot tell you that. The machine is measuring something real, and measuring it well. It is just not measuring the thing most people assume it predicts.
What the machine actually measures
An isokinetic dynamometer holds the limb at a fixed angular velocity — slow, such as 60°/s, or fast, such as 300°/s — and records the torque the athlete produces through the range. Because the speed is controlled, the muscle can be loaded maximally at every joint angle, which is why isokinetic testing is treated as the reference standard for knee strength.
From those torques come the ratios. The conventional hamstring-to-quadriceps (H:Q) ratio divides concentric hamstring torque by concentric quadriceps torque. The functional ratio uses eccentric hamstring torque instead, on the reasoning that the hamstring is usually injured while lengthening to brake the swinging shank. Both make intuitive sense: a hamstring that is weak relative to the quadriceps it has to control sounds like a hamstring at risk.
The intuition is the problem. It is a mechanistic story, and the question of whether it predicts anything is an empirical one that has now been tested several times.
What the prediction studies found
A systematic review and meta-analysis pooled every prospective study that tested isokinetic hamstring, quadriceps or hip extensor strength as a risk factor for later hamstring strain.1 The included studies covered angular velocities from 30 to 300°/s, concentric and eccentric modes, absolute and bodyweight-relative values, and strength ratios built across that whole range of speeds.
Read that last tile again. Not one strength ratio, conventional or functional, at any testing speed, was associated with subsequent hamstring strain. The single positive finding — slow eccentric hamstring strength, along with its bodyweight-relative version (SMD −0.17) — was small, and the best evidence synthesis found that over half of all the variables examined had moderate or strong evidence for no association.1 The authors concluded that the role of isokinetic assessment for predicting hamstring strain risk should be reconsidered, particularly given its cost and the specialised training it requires.
The largest single cohort
One of the main reasons earlier studies disagreed was that they were too small to detect small effects. So one research group tested 614 professional footballers from 14 teams in preseason and followed them for four seasons, specifically to build an adequately powered answer.2
Lower slow-speed quadriceps concentric strength (OR 1.41) and lower slow-speed hamstring eccentric strength (OR 1.37) were independently associated with injury.2 At group level, that is a real signal. At the level of one athlete in a chair, an area under the curve of 0.54 to 0.56 means the test sorts injured from uninjured players barely better than chance. The authors' own wording is blunt: these are weak risk factors, the wide overlap in strength between groups does not allow individual players at risk to be identified, and the use of isokinetic testing to determine the association between strength differences and hamstring injury is not supported.2
That distinction — a group-level association that is useless for screening individuals — runs through almost every injury-prediction literature, and it is the same pattern that shows up in what force plate data can and cannot predict.
What about young athletes?
Neither study above was designed around young athletes; the cohort was professional. The youth-specific prospective data are thinner, but a recent five-season cohort is directly relevant. It tested 271 female footballers across professional, under-20 and under-17 squads before each season, calculating conventional and functional H:Q ratios and limb symmetry, and recorded 70 noncontact lower-limb injuries.3
Here the ratio did show something. A lower conventional H:Q ratio was associated with higher injury risk across the whole cohort (adjusted OR 0.78, 95% CI 0.62–0.98) and for muscle injuries specifically (adjusted OR 0.67).3 No significant independent predictors were found for ankle injuries or for knee injuries other than ACL rupture — and the predictor reported for ACL rupture was not a strength measure at all but a previous ACL injury.
The authors' conclusion is worth quoting in substance: preseason isokinetic testing has limited independent predictive utility, should not be used as a standalone screening tool, and is better used inside a broader assessment battery for monitoring and rehabilitation.3 Even in the one youth cohort where the ratio carried some association, the people who ran the study do not recommend using it to pick out at-risk athletes.
The noise problem in children
Prediction is one question. Whether the number is stable enough to track is another, and in children it matters more because they are growing between tests.
A systematic review of test-retest reliability for isokinetic knee testing in children aged 5 to 15 pooled five studies with 96 participants in its meta-analysis.4 The pooled intraclass correlation was 0.90 for concentric knee extension and 0.84 for flexion at 60°/s — high and excellent, in the conventional language. That sounds reassuring, and for ranking a group of children it largely is.
The more useful figures are buried further down. Only two of the included studies reported the smallest real difference — the change needed before you can be confident it is not measurement noise. For concentric knee extension at 60°/s it was around 15 Nm, or about 31%. For knee flexion it was around 9.8 to 13.0 Nm, or 36.5 to 38.5%.4
Put plainly: in a child, a hamstring score has to move by something like a third before the change can be distinguished from noise. And the H:Q ratio is one noisy number divided by another. The review also notes that most authors expected second tests to score higher because of a learning effect, and that children of this age may need extra familiarisation.4 A first-ever test and a retest a few months later are not measuring quite the same thing.
Outside the lab
Most young athletes will never sit in an isokinetic chair. The practical substitute is a hand-held dynamometer, which costs a fraction as much and fits in a kit bag. A meta-analysis of 17 studies compared the two directly.5
For knee extension, the limits of agreement for repeated hand-held testing were 33.59% of the mean, against 3.32% for the isokinetic device. For knee flexion the figures were 16.92% and 2.09%.5 Agreement between the two devices was moderate for the knee: intraclass correlations of 0.78 for the flexors and 0.64 for the extensors. In other words, the field tool is considerably noisier than the lab tool, and its numbers are not interchangeable with the lab's — so a hand-held reading cannot be compared against isokinetic norms, or against an earlier isokinetic test on the same athlete.
That leaves an awkward position. The lab device is precise but expensive, time-consuming and needs trained operators. The field device is accessible but less precise. And the thing both are most often used to estimate — individual injury risk — is something neither has been shown to predict well.
What this changes in practice
Read the ratio as a description, not a forecast. An H:Q ratio says something true about the balance of strength on the day. The prospective evidence says it does not reliably identify which athlete will be injured, and no ratio was associated with hamstring strain in the pooled data.
Do not train to hit a cut-off. If no threshold separates injured from uninjured athletes, then "fixing" a ratio is a programming goal without an outcome attached. Building eccentric hamstring strength is defensible on other grounds; chasing a number on a printout is not.
Compare the athlete with themselves, and only believe big changes. In children, a real change on the dynamometer is in the region of 31–38%. A 10% improvement between tests may be training, maturation, familiarity with the machine, or nothing.
Familiarise before the test that counts. Learning effects inflate second tests. A practice session in the chair makes the first recorded number more meaningful.
Do not switch devices between tests. Hand-held and isokinetic dynamometers agree only moderately at the knee. A baseline on one and a retest on the other measures the instrument change as much as the athlete.
Use it where it earns its place. Comparing an injured limb with the uninjured one during rehabilitation is a different job from screening healthy athletes, and it is where the cohort authors suggest isokinetic profiles belong — alongside the hop tests and symmetry measures in a return-to-play battery rather than as a stand-alone verdict.
Where this evidence stops
The meta-analysis and the 614-player cohort are about hamstring strain, and the cohort is professional players. Neither tells us directly how isokinetic profiles behave in a twelve-year-old, nor whether they predict other injuries such as ACL rupture. The meta-analysis also pooled studies with very different protocols, which may itself blur small effects.
The youth cohort is recent, female-only, drawn from one football system, and mixes professional and youth squads; its abstract does not report the under-17 and under-20 players separately, and only 11 of its 70 injuries were ACL ruptures. Its positive H:Q association has not yet been replicated.
The reliability review rests on 96 children, one of its five pooled studies involved children with cerebral palsy rather than healthy young athletes, and the smallest-real-difference figures come from just two studies. The device-comparison meta-analysis was drawn entirely from adults, its included studies were rated fair to poor, and most had fewer than 20 participants. None of these studies accounts for biological maturation, which changes strength substantially in adolescence regardless of training.
What the evidence supports is narrower than the printout implies: isokinetic testing measures knee strength precisely in a lab, measures it less precisely in children than the reliability coefficients suggest, and does not, on current evidence, tell you which young athlete is going to get hurt.
Sources
- Green, B., Bourne, M. N., & Pizzari, T. (2018). Isokinetic strength assessment offers limited predictive validity for detecting risk of future hamstring strain in sport: a systematic review and meta-analysis. British Journal of Sports Medicine, 52(5), 329-336. https://doi.org/10.1136/bjsports-2017-098101
- van Dyk, N., Bahr, R., Whiteley, R., Tol, J. L., Kumar, B. D., Hamilton, B., Farooq, A., & Witvrouw, E. (2016). Hamstring and quadriceps isokinetic strength deficits are weak risk factors for hamstring strain injuries: a 4-year cohort study. The American Journal of Sports Medicine, 44(7), 1789-1795. https://doi.org/10.1177/0363546516632526
- Seiler, J., Haas, A., Gnädinger, D., Bode, G., Rosa, M., Prill, R., Schmal, H., & Bode, L. (2026). Limited predictive value of preseason isokinetic strength testing for noncontact lower extremity injuries in elite female football players: a 5-year prospective cohort study. Knee Surgery, Sports Traumatology, Arthroscopy. Advance online publication. https://doi.org/10.1002/ksa.70623
- Muñoz-Bermejo, L., Pérez-Gómez, J., Manzano, F., Collado-Mateo, D., Villafaina, S., & Adsuar, J. C. (2019). Reliability of isokinetic knee strength measurements in children: a systematic review and meta-analysis. PLoS ONE, 14(12), e0226274. https://doi.org/10.1371/journal.pone.0226274
- Chamorro, C., Armijo-Olivo, S., De la Fuente, C., Fuentes, J., & Chirosa, L. J. (2017). Absolute reliability and concurrent validity of hand held dynamometry and isokinetic dynamometry in the hip, knee and ankle joint: systematic review and meta-analysis. Open Medicine, 12, 359-375. https://doi.org/10.1515/med-2017-0052
Want this applied to your own program, team, or school? Free 20-minute consult, no obligation.
Book a free consult →